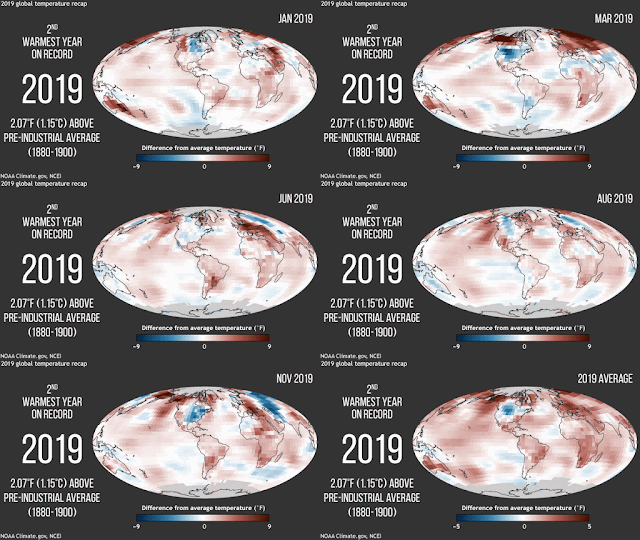
This animation shows monthly temperatures for January–December 2019 compared to each month's 1981-2010 average. The final frame of animation shows where annual temperatures were warmer (red) or colder (blue) than average. NOAA Climate.gov, based on data from NCEI.
Online — Given the size and tremendous heat capacity of the global oceans, it takes a massive amount of accumulated heat energy to raise Earth’s average yearly surface temperature even a small amount.
Behind the seemingly small increase in global average surface temperature over the past century is a significant increase in accumulated heat. That extra heat is driving regional and seasonal temperature extremes, reducing snow cover and sea ice, intensifying heavy rainfall, and changing habitat ranges for plants and animals—expanding some and shrinking others.
Read the full story online at:
https://www.climate.gov/news-features/understanding-climate/climate-change-global-temperature

No comments:
Post a Comment